








Task 1 grafico a torta
Risposta di esempio
di Bianca e Laura (studentesse di IELTS Dublin)
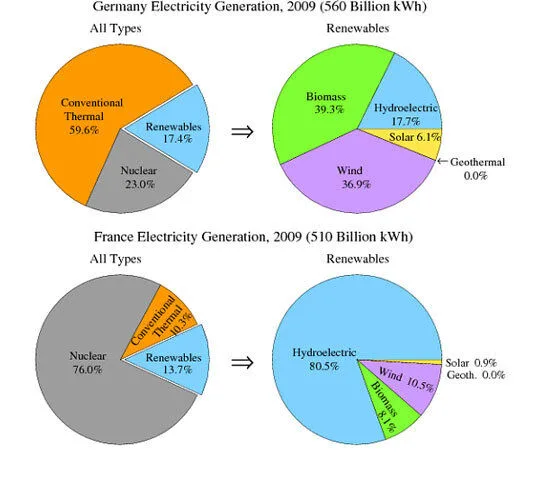
Dovresti dedicare circa 20 minuti a questo task.I grafici a torta mostrano l’elettricità prodotta in Germania e in Francia da tutte le fonti e da fonti rinnovabili nel 2009.
Riassumi le informazioni selezionando e descrivendo le caratteristiche principali e fai confronti dove opportuno.
Scrivi almeno 150 parole.
The graph compares the different percentages of the main sources of energy between Germany and France in 2009. Some of the main sources included conventional thermal, nuclear and renewables. The various sources of energy are divided into “all types” and “renewables:. Renewables are broken down into biomass, hydroelectric and wind.
The main source of electricity in Germany came from conventional thermal, while in France power originated from Nuclear sources. On the other hand, in terms of renewables, there were not substantial differences between the two countries, indeed in both countries the percentage of this type of electricity was less than a fifth. In addition the pie shows that the main source of renewables in Germany originated from biomass, whereas in France it came from hydroelectric. Lastly, in both the countries the percentage of the geothermal was non-existent.
To sum up, the methods of electricity generation was very different when we compare the sources in the two countries.
Testo scritto da Laura e Bianca, studentesse di Everest Language School.
Questo esempio otterrebbe tra 6 e 7 all’IELTS:

Altre espressioni utili per i grafici a torta del Task 1 IELTS:
Varia il tuo linguaggio
Come in ogni Task 1, è importante. Non devi ripetere sempre le stesse strutture. Il lessico chiave quando descrivi un grafico a torta riguarda proporzioni (proportions) e percentuali (percentages).
Le espressioni più comuni sono “the proportion of…” o “the percentage of…”
Puoi però usare anche altre parole e frazioni. Ecco alcuni esempi dalla risposta modello:
A large number of people
over a quarter of people
a small minority
A significant number of people
less than a fifth
Questa tabella mostra alcuni esempi di come trasformare le percentuali in frazioni o rapporti:
Percentuale
Frazione
Percentuale
Frazione
40%
two-fifths
80%
four-fifths
35%
more than a third
75%
three-quarters
30%
less than a third
70%
seven in ten
25%
a quarter
65%
two-thirds
20%
a fifth
60%
three-fifths
15%
less than a fifth
55%
more than half
10%
one in ten
50%
half
5%
one in twenty
45%
more than two fifths
Se le percentuali non sono esatte come sopra, puoi usare dei qualificatori perché la tua descrizione resti precisa. Ecco alcuni esempi:
Percentuale
Qualificatore
77%
just over three quarters
77%
approximately three quarters
49%
just under a half
49%
nearly a half
32%
almost a third
Questa tabella mostra alcuni esempi di come trasformare le percentuali in altre espressioni:
75% – 85%
a very large majority
65% – 75%
a significant proportion
10% – 15%
a minority
5%
a very small number
Queste parole sono intercambiabili, ma ricorda: number si usa con i sostantivi numerabili e amount con i sostantivi non numerabili.