


Task 1 Kreisdiagramm
Musterantwort
von Bianca und Laura (Teilnehmerinnen von IELTS Dublin)
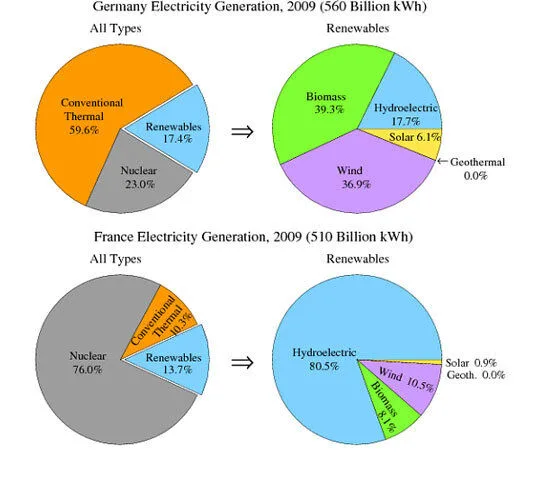
You should spend about 20 minutes on this task.The pie charts show the electricity generated in Germany and France from all sources and renewables in the year 2009.
Summarize the information by selecting and reporting the main features and make comparisons where relevant.
Write at least 150 words.
The graph compares the different percentages of the main sources of energy between Germany and France in 2009. Some of the main sources included conventional thermal, nuclear and renewables. The various sources of energy are divided into “all types” and “renewables:. Renewables are broken down into biomass, hydroelectric and wind.
The main source of electricity in Germany came from conventional thermal, while in France power originated from Nuclear sources. On the other hand, in terms of renewables, there were not substantial differences between the two countries, indeed in both countries the percentage of this type of electricity was less than a fifth. In addition the pie shows that the main source of renewables in Germany originated from biomass, whereas in France it came from hydroelectric. Lastly, in both the countries the percentage of the geothermal was non-existent.
To sum up, the methods of electricity generation was very different when we compare the sources in the two countries.
Text von Laura und Bianca, Teilnehmerinnen an der Everest Language School.
Diese Antwort würde im IELTS zwischen 6 und 7 Punkte erreichen:

Weitere nützliche Formulierungen für IELTS Task 1 mit Kreisdiagrammen:
Variiere deine Sprache
Wie bei jeder Task 1 ist das wichtig. Wiederhole nicht ständig dieselben Strukturen. Die zentralen Begriffe bei Kreisdiagrammen sind Anteile und Prozentsätze.
Häufige Formulierungen sind „the proportion of…“ oder „the percentage of…“
Du kannst aber auch andere Wörter und Brüche verwenden. Hier einige Beispiele aus der Musterantwort:
A large number of people
over a quarter of people
a small minority
A significant number of people
less than a fifth
Diese Tabelle zeigt dir, wie du Prozentangaben in Brüche oder Verhältnisse umwandeln kannst:
Prozent
Bruch
Prozent
Bruch
40 %
two-fifths
80 %
four-fifths
35 %
more than a third
75 %
three-quarters
30 %
less than a third
70 %
seven in ten
25 %
a quarter
65 %
two-thirds
20 %
a fifth
60 %
three-fifths
15 %
less than a fifth
55 %
more than half
10 %
one in ten
50 %
half
5 %
one in twenty
45 %
more than two fifths
Wenn die Prozentsätze nicht so genau passen wie oben, kannst du Einschränkungen verwenden, damit deine Beschreibung korrekt bleibt. Hier einige Beispiele:
Prozent
Einschränkung
77 %
just over three quarters
77 %
approximately three quarters
49 %
just under a half
49 %
nearly a half
32 %
almost a third
Diese Tabelle zeigt dir, wie du Prozentangaben durch andere Formulierungen ersetzen kannst:
75 % – 85 %
a very large majority
65 % – 75 %
a significant proportion
10 % – 15 %
a minority
5 %
a very small number
Die Wörter oben sind austauschbar. Beachte aber: number steht bei zählbaren Nomen, amount bei nicht zählbaren Nomen.