



Task 1 con gráfico circular
Respuesta de ejemplo
de Bianca y Laura (estudiantes de IELTS Dublin)
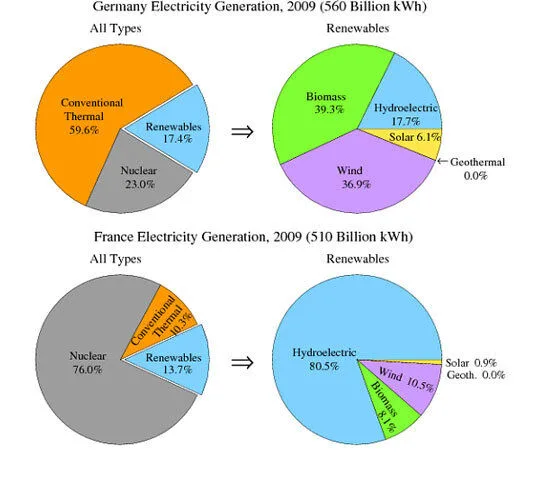
Deberías dedicar unos 20 minutos a esta tarea.The pie charts show the electricity generated in Germany and France from all sources and renewables in the year 2009.
Summarize the information by selecting and reporting the main features and make comparisons where relevant.
Write at least 150 words.
The graph compares the different percentages of the main sources of energy between Germany and France in 2009. Some of the main sources included conventional thermal, nuclear and renewables. The various sources of energy are divided into “all types” and “renewables:. Renewables are broken down into biomass, hydroelectric and wind.
The main source of electricity in Germany came from conventional thermal, while in France power originated from Nuclear sources. On the other hand, in terms of renewables, there were not substantial differences between the two countries, indeed in both countries the percentage of this type of electricity was less than a fifth. In addition the pie shows that the main source of renewables in Germany originated from biomass, whereas in France it came from hydroelectric. Lastly, in both the countries the percentage of the geothermal was non-existent.
To sum up, the methods of electricity generation was very different when we compare the sources in the two countries.
Redacción de Laura y Bianca, estudiantes de Everest Language School.
Este ejemplo obtendría entre un 6 y un 7 en el IELTS:

Más expresiones útiles para los gráficos circulares de la Task 1 del IELTS:
Varía tu lenguaje
Como en cualquier Task 1, esto es importante. No repitas siempre las mismas estructuras. El vocabulario clave para escribir sobre gráficos circulares son las proporciones y los porcentajes.
Las expresiones más habituales son “the proportion of…” o “the percentage of…”
Pero también puedes usar otras palabras y fracciones. Estos son algunos ejemplos de la respuesta modelo:
A large number of people
over a quarter of people
a small minority
A significant number of people
less than a fifth
Esta tabla muestra algunos ejemplos de cómo convertir porcentajes en fracciones o proporciones:
Porcentaje
Fracción
Porcentaje
Fracción
40 %
two-fifths
80 %
four-fifths
35 %
more than a third
75 %
three-quarters
30 %
less than a third
70 %
seven in ten
25 %
a quarter
65 %
two-thirds
20 %
a fifth
60 %
three-fifths
15 %
less than a fifth
55 %
more than half
10 %
one in ten
50 %
half
5 %
one in twenty
45 %
more than two fifths
Si los porcentajes no son exactos como los de arriba, puedes usar matizadores para que tu descripción siga siendo precisa. Aquí tienes algunos ejemplos:
Porcentaje
Matizador
77 %
just over three quarters
77 %
approximately three quarters
49 %
just under a half
49 %
nearly a half
32 %
almost a third
Esta tabla muestra algunos ejemplos de cómo convertir porcentajes en otras expresiones:
75 % – 85 %
a very large majority
65 % – 75 %
a significant proportion
10 % – 15 %
a minority
5 %
a very small number
Las palabras anteriores son intercambiables, aunque number se usa con sustantivos contables y amount con sustantivos incontables.