


Task 1 diagramme circulaire
Exemple de réponse
par Bianca et Laura (élèves d’IELTS Dublin)
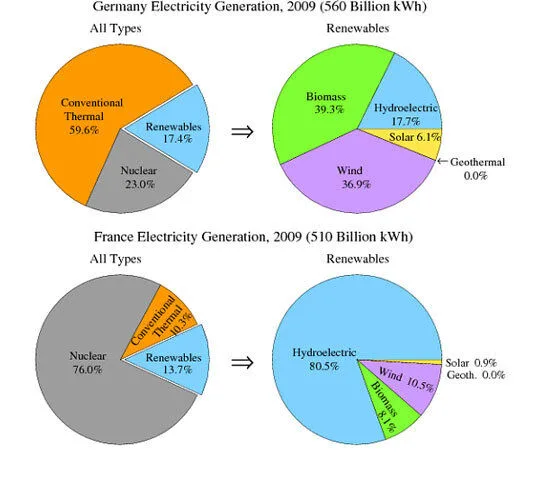
You should spend about 20 minutes on this task.The pie charts show the electricity generated in Germany and France from all sources and renewables in the year 2009.
Summarize the information by selecting and reporting the main features and make comparisons where relevant.
Write at least 150 words.
The graph compares the different percentages of the main sources of energy between Germany and France in 2009. Some of the main sources included conventional thermal, nuclear and renewables. The various sources of energy are divided into “all types” and “renewables:. Renewables are broken down into biomass, hydroelectric and wind.
The main source of electricity in Germany came from conventional thermal, while in France power originated from Nuclear sources. On the other hand, in terms of renewables, there were not substantial differences between the two countries, indeed in both countries the percentage of this type of electricity was less than a fifth. In addition the pie shows that the main source of renewables in Germany originated from biomass, whereas in France it came from hydroelectric. Lastly, in both the countries the percentage of the geothermal was non-existent.
To sum up, the methods of electricity generation was very different when we compare the sources in the two countries.
Rédaction de Laura et Bianca, élèves à Everest Language School.
Cet exemple obtiendrait entre 6 et 7 à l’IELTS :

D’autres expressions utiles pour les diagrammes circulaires de la Task 1 de l’IELTS :
Varie ton vocabulaire
Comme pour toute Task 1, c’est important. Évite de répéter toujours les mêmes structures. Le vocabulaire clé pour décrire un diagramme circulaire, ce sont les proportions et les pourcentages.
Les expressions les plus courantes sont « the proportion of… » ou « the percentage of… »
Mais tu peux aussi utiliser d’autres mots et des fractions. Voici quelques exemples tirés de la réponse modèle :
A large number of people
over a quarter of people
a small minority
A significant number of people
less than a fifth
Ce tableau montre comment transformer des pourcentages en fractions ou en proportions :
Pourcentage
Fraction
Pourcentage
Fraction
40%
two-fifths
80%
four-fifths
35%
more than a third
75%
three-quarters
30%
less than a third
70%
seven in ten
25%
a quarter
65%
two-thirds
20%
a fifth
60%
three-fifths
15%
less than a fifth
55%
more than half
10%
one in ten
50%
half
5%
one in twenty
45%
more than two fifths
Si les pourcentages ne sont pas aussi exacts que ci-dessus, tu peux utiliser des qualificatifs pour que ta description reste précise. Voici quelques exemples :
Pourcentage
Qualificatif
77%
just over three quarters
77%
approximately three quarters
49%
just under a half
49%
nearly a half
32%
almost a third
Ce tableau montre comment remplacer des pourcentages par d’autres expressions :
75% – 85%
a very large majority
65% – 75%
a significant proportion
10% – 15%
a minority
5%
a very small number
Ces mots sont interchangeables, mais number s’emploie avec les noms dénombrables et amount avec les noms indénombrables.