








IELTS Task 1 Band 9
Voici un exemple de sujet IELTS Task 1 avec une réponse modèle. Cette réponse obtiendrait, selon nos estimations, un score de Band 9. Lis d’abord la réponse, puis nous l’analyserons en détail.
source : IELTS Buddy
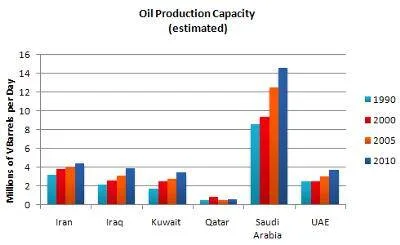
The table below shows the estimated oil capacity of six countries, in millions of barrels per day, from 1990 to 2010.
Summarise the information by selecting and reporting the main features, and make comparisons where relevant.
You should spend about 20 minutes on this task.
Write at least 150 Words.
Réponse modèle
The bar chart illustrates the estimated amount of oil produced in 6 countries between 1990 and 2010, measured in millions of barrels per day.
Overall, oil production capacity tended to increase during this 20-year period. The figures for Saudi Arabia were significantly higher than in the other countries, while production was lowest in Qatar.
From 1990 to 2010, there was a significant increase in oil production in Saudi Arabia. In 1990, just over 8 million barrels per day were produced and this rose steadily, reaching a peak of over 14 million barrels per day in 2010. In contrast, the smallest producer was Qatar. Despite a slight increase in 2000, production in Qatar remained relatively stable at less than 1 million barrels per day.
The other countries saw a slight rise in oil production over the period. The estimated figure for Iran in 1990 was over 3 million barrels per day, compared with around 2 million barrels in the other three countries. Although production did not increase in 2000 in the UAE, the amount of oil produced peaked in 2010 in Iran at over 4 million barrels and at almost 4 million barrels in Iraq, Kuwait and the UAE.
(198 mots)
IELTS Task 1 : score Band 9
Réalisation de la tâche (Task Achievement) : 9
Cohérence et cohésion : 9
Ressources lexicales : 9
Grammaire : 9
Score global : Band 9
Analyse
Paragraphe 1
Le premier paragraphe contient toutes les informations clés sur le graphique, mais il reformule la question. C’est très important. Pense à utiliser des synonymes et à reformuler ta réponse. Par exemple, ici :
« shows » devient « illustrates »
« oil capacity » devient « amount of oil »
« from 1990 to 2010 » devient « between 1990 and 2010 »
Paragraphe 2
Ce paragraphe donne une vue d’ensemble claire du graphique. La tendance générale est une hausse de la capacité, mais il y a un grand écart entre l’Arabie saoudite et le Qatar. Ce paragraphe montre une excellente maîtrise de la grammaire et du vocabulaire attendus : « Tended to increase » ; « 20-year period » (et non 20-year s period) ; « significantly higher than ».
Paragraphe 3
Ce paragraphe détaille les deux pays les plus marquants : l’Arabie saoudite et le Qatar. Il découle clairement du paragraphe précédent, qui avait mis ces deux pays en avant. Tout le vocabulaire clé pour décrire l’évolution d’un graphique est utilisé correctement (« significant increase » ; « rose steadily » ; « reaching a peak » ; « remained relatively stable »). Il y a deux phrases sur l’Arabie saoudite, puis deux sur le Qatar, reliées correctement par l’expression « in contrast ». Le paragraphe est très bien structuré et cohérent, sans aucune faute de grammaire et avec un vocabulaire excellent et varié.
Paragraphe 4
Le paragraphe 4 donne des détails sur les quatre autres pays. Là encore, tout le vocabulaire pour décrire un graphique est précis : « saw a slight rise », « peaked in 2010 ». Les prépositions sont aussi bien employées (les élèves les confondent souvent) : « a rise in production », « in 1990 », « compared with » , « peaked in 2010 in Iran at over 4 million barrels »
Bilan
Cette réponse réunit tout ce qu’il faut pour obtenir un Band 9 à l’IELTS Task 1. Elle est claire et bien structurée, avec un usage habile des paragraphes et des connecteurs. On y trouve un vocabulaire riche et très naturel pour décrire un graphique, sans aucune faute d’orthographe. Il n’y a aucune faute de grammaire et les structures complexes sont excellentes et variées.
Barème de notation de l’IELTS Task 1 :
Descripteurs de notation IELTS Task 1 Writing (PDF)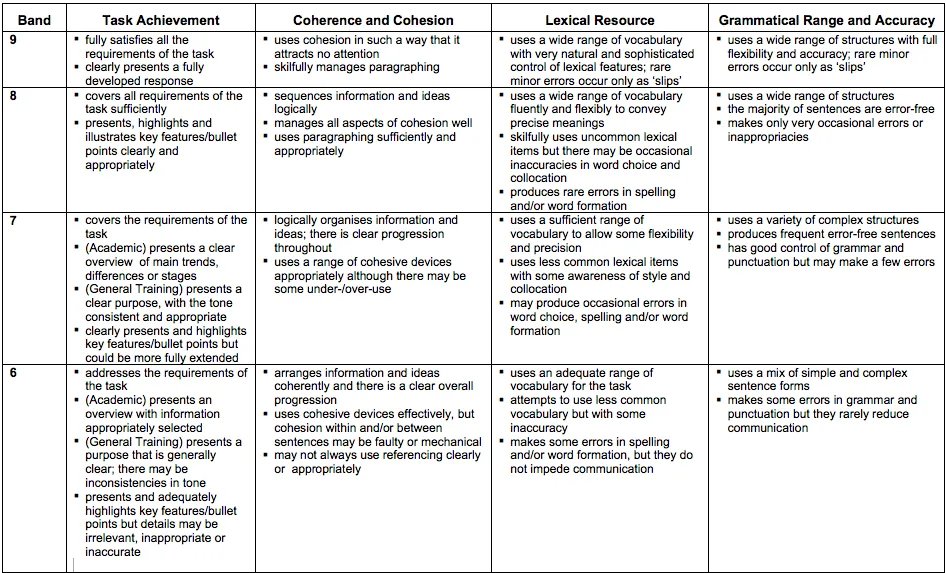
Cet article a été rédigé par Conor Reid, professeur à Everest Language School et podcasteur littéraire
Tu peux préparer l’examen IELTS à Dublin dans l’un de nos cours IELTS Preparation.